
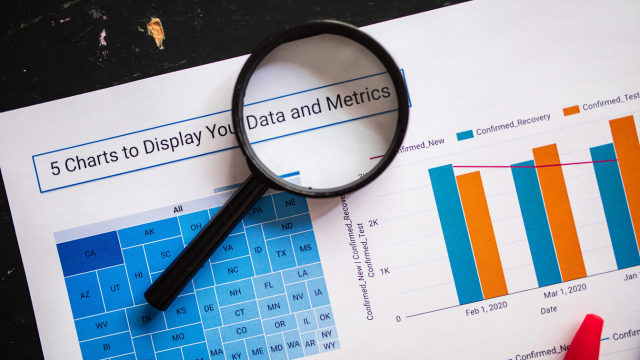
If you are asking what is data analysis, the simplest answer is this: data analysis is the process of examining information to understand what it tells you.
Businesses use it to understand customers and performance. Researchers use it to investigate questions and test ideas. Governments use it to understand populations and public services. A student may analyse survey responses for a dissertation, while a retailer might analyse sales data to discover which products perform best.
The process usually involves much more than looking at numbers. Analysts may need to collect information, clean errors, organise records, compare groups, identify patterns, calculate statistics, create visualisations and explain what the results actually mean.
That is what is data analysis all about: turning raw information into evidence that can support understanding or decisions.
For beginners, the subject can initially appear technical because it includes statistics, Excel, SQL, visualisation and sometimes programming. You do not need to master all of these immediately. The best place to start is understanding the analytical process and learning how to ask useful questions of data.
This guide explains data analysis in simple terms, including what is data analysis in research, what is data analysis in statistics, what is data analysis in Excel, qualitative analysis, interpretation, essential skills, training and what is data analyst job work like in practice.
What Is Data Analysis in Simple Words?
What is data analysis in simple words? It means taking information and examining it systematically to find something useful.
Imagine you run a small café and record the number of coffees sold each day.
A table containing 365 daily sales figures is data.
Analysis begins when you start asking questions such as:
- Which day of the week has the highest sales?
- Did sales increase compared with last year?
- Which months are quietest?
- Do rainy days affect demand?
- How many staff might be needed on Saturdays?
The figures themselves do not automatically provide the answer. You need to organise, compare and interpret them.
The result of that process may help the café owner decide when to schedule more employees or run promotions.
What Is Data Analysis All About?
Data analysis is fundamentally about answering questions with evidence and turning information into useful insights.
That usually involves several connected stages.
First, you define the question. Then you identify appropriate data, check its quality and decide which analytical method is suitable. After performing the analysis, you interpret the results and communicate them in a way that the intended audience can understand.
This sequence matters because an impressive chart cannot rescue a badly defined question. Effective data analysis depends on having a clear objective and reliable information.
For example, suppose a company wants to understand why customer satisfaction has fallen. Simply calculating average satisfaction scores may show that a decline exists, but it may not explain why.
The analyst might need to compare:
different branches;
customer groups;
products;
time periods;
complaint categories.
Analysis becomes useful when it connects data to the problem being investigated and turns raw information into actionable insights.
The Main Stages of Data Analysis
Real projects vary, but a beginner can think of the data analysis process in six stages:
- Define the question – establish what you are trying to understand.
- Collect or obtain data – identify appropriate information.
- Clean and prepare it – correct errors and organise the dataset.
- Analyse it – apply suitable statistical or qualitative techniques.
- Interpret the findings – decide what the results do and do not show.
- Communicate the answer – use clear writing, tables or visualisations.
These stages often overlap.
An analyst might discover during analysis that the data contain missing values, return to the cleaning stage and then repeat the analysis. Professional data analysis work is therefore usually iterative rather than perfectly linear.
What Is Data Analysis in Research?
What is data analysis in research? It is the systematic examination of evidence collected or obtained to answer a research question.
Researchers may analyse information gathered through:
surveys;
experiments;
interviews;
observations;
administrative records;
existing datasets.
The analytical method should match both the research question and the type of data. This is an important part of research data analysis because different forms of evidence require different approaches.
Suppose researchers want to investigate whether average commuting time is associated with reported job satisfaction. They might collect numerical survey responses and use statistical techniques.
A different study might ask how employees describe the emotional effects of long commutes. Researchers could conduct interviews and analyse recurring themes in people’s responses.
Both projects involve data analysis, but the methods are different.
Primary and Secondary Data Analysis
Researchers do not always collect their own data.
Primary analysis generally involves analysing information collected specifically for the current project.
Secondary analysis involves using existing data originally collected for another purpose.
The UK Data Service describes secondary analysis as reanalysing qualitative or quantitative data from an earlier study to address a new research question.
For example, a researcher studying working patterns might analyse an existing national survey rather than conduct a completely new survey.
Secondary data can save substantial time and provide access to large datasets, but the researcher must understand how the original information was collected and whether it actually suits the new question. This helps ensure that the data analysis methods are appropriate for the research objective.
Quantitative vs Qualitative Data Analysis
One of the most important beginner distinctions is between quantitative and qualitative analysis.
| Type | Typical data | Common purpose |
| Quantitative | Numbers, measurements, counts, ratings | Measuring patterns, differences and relationships |
| Qualitative | Words, interviews, observations, images | Understanding experiences, meanings and themes |
These approaches are not competitors. A project can use both.
For example, a hospital might analyse numerical waiting-time data while also analysing patient interview responses about their experiences.
The numerical analysis could show where delays occur. The qualitative analysis could help explain how those delays affect patients. Combining both approaches can provide a broader data-driven understanding of a problem.
What Is Data Analysis in Qualitative Research?
What is data analysis in qualitative research? It is the systematic examination of non-numerical information to identify meanings, concepts, experiences or patterns.
Qualitative data can include:
interview transcripts;
focus-group discussions;
diaries;
open-ended questionnaire responses;
field notes;
images.
A researcher might read 40 interview transcripts and identify recurring themes relating to workplace stress.
The process is not simply selecting a few interesting quotations. A credible qualitative approach normally requires systematic decisions about how material is coded, grouped and interpreted.
Thematic Analysis
One widely used qualitative approach is thematic analysis.
The researcher examines the material and identifies patterns of meaning or themes. Imagine employees are interviewed about remote working.
Repeated ideas might include:
greater flexibility;
social isolation;
reduced commuting;
difficulty separating work and home;
improved concentration.
The researcher could organise these observations into broader themes and investigate how they relate to the research question.
Qualitative analysis still requires evidence and transparency. Researchers should be able to explain how they moved from raw material to their conclusions. This supports a more systematic qualitative data analysis process.
What Is Data Analysis in Statistics?
What is data analysis in statistics? It means using statistical methods to describe data, examine relationships and, where appropriate, draw conclusions beyond the observations directly collected.
Statistics is a major part of quantitative data analysis. Two broad areas are especially useful for beginners.
Descriptive Statistics
Descriptive statistics summarise what the dataset contains.
Common measures include:
- mean;
- median;
- mode;
- percentages;
- minimum and maximum;
- standard deviation.
Suppose 100 customers rate a service from 1 to 5.
Calculating the average rating is descriptive analysis. It summarises the observed responses and provides a simple statistical summary of the dataset.
Inferential Statistics
Inferential statistics goes further.
It can help researchers use a sample to make carefully qualified conclusions about a wider population.
Methods may include:
confidence intervals;
hypothesis tests;
regression;
correlation.
These methods require more statistical knowledge because results can easily be misinterpreted.
A significant statistical relationship does not automatically prove that one variable caused another. Analysts therefore need to understand both statistical results and their limitations.
Correlation Is Not Causation
This principle deserves special attention.
Suppose analysis finds that ice-cream sales and sunburn cases both increase during the same months. It would be unreasonable to conclude that buying ice cream causes sunburn.
A third factor—hot, sunny weather—helps explain both.
Data analysis can identify relationships. Establishing cause and effect usually requires stronger research design and additional evidence.
Good analysts therefore distinguish between what the data show and what they merely suggest. This is an important part of responsible data interpretation.
What Is Data Analysis and Interpretation?
What is data analysis and interpretation? Analysis is the process of examining the data; interpretation is the process of explaining what the findings mean in context.
Suppose a sales dataset shows:
2024 revenue: £500,000
2025 revenue: £550,000
Analysis may calculate that revenue increased by 10%.
Interpretation asks what that increase means.
Was it caused by:
higher prices;
more customers;
a new product;
inflation;
a longer trading period?
The numerical change is clear. Its explanation may require additional evidence.
This is why good analytical reports do not simply fill pages with percentages and charts. They explain the important findings, give appropriate context and acknowledge uncertainty. Effective data interpretation connects statistical results with the wider business or research context.
Data Analysis Example: An Online Shop
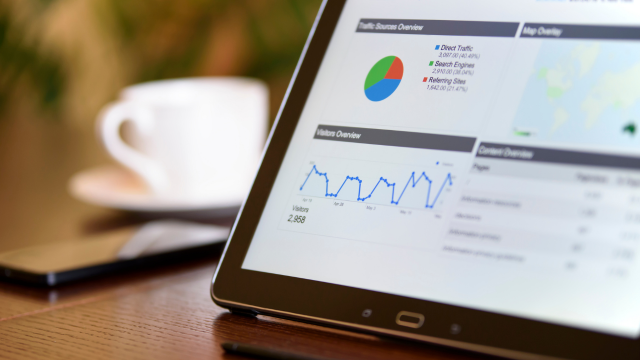
A simple Data analysis example can show how the process works.
Imagine an online retailer has 20,000 orders from the previous year.
Management asks:
Why did revenue fall during the summer?
The analyst first checks the dataset for:
missing transactions;
duplicate records;
incorrect dates;
unusual values.
Once the data are reasonably clean, the analyst compares monthly revenue.
The decline appears concentrated in June and July.
Next, sales are broken down by product category. The analysis reveals that most categories remained relatively stable, but outdoor furniture revenue fell sharply.
The analyst then compares:
number of orders;
average order value;
website traffic;
conversion rate.
Traffic remained similar, but conversion dropped.
That suggests the problem was not simply fewer website visitors.
Further investigation might examine:
price changes;
stock shortages;
competitor promotions;
website problems.
The final conclusion could be that several popular outdoor products were unavailable for much of June and July.
Notice what happened.
The analyst did not merely create a revenue graph. They moved from a broad business question towards increasingly specific evidence.
That is What is data analysis work in a practical setting: using data to investigate a problem, identify patterns and support evidence-based decisions.
What Is Data Analysis in Computer?
The phrase what is data analysis in computer usually refers to using computer software to organise, process, analyse and visualise data.
Modern datasets can contain thousands or millions of records, making manual analysis impractical.
Common analytical tools include:
Excel;
SQL;
Python;
R;
Power BI;
Tableau;
specialist statistical software.
Different tools solve different problems.
Excel may be sufficient for a small business spreadsheet. SQL is particularly useful for retrieving structured information from databases. Python and R can handle more advanced statistics, automation and large analytical workflows.
Power BI and Tableau are widely associated with interactive dashboards and business intelligence.
Together, these technologies support modern computer-based data analysis and data visualisation.
Do You Need Programming for Data Analysis?
Not always.
Many people begin data analysis using spreadsheets.
Programming becomes increasingly useful when you need to:
automate repetitive analysis;
work with larger datasets;
perform advanced statistics;
combine multiple data sources;
build reproducible workflows.
Python and R are common choices. SQL is also extremely valuable because organisational data is frequently stored in relational databases.
A beginner does not need to learn every tool simultaneously. It is usually better to become competent with one analytical workflow before continually switching technologies.
What Is Data Analysis in Excel?
What is data analysis in Excel? It means using Excel’s spreadsheet features to organise, calculate, explore and present data.
Excel remains useful because it combines data storage, calculations and visualisation within one familiar environment.
A beginner might use:
formulas;
sorting;
filters;
tables;
charts;
PivotTables.
More experienced users may work with:
Power Query;
data models;
Power Pivot;
advanced formulas.
Microsoft’s current Analyze Data feature can also identify trends, summaries and possible visualisations using natural-language questions.
These features make Excel a practical starting point for spreadsheet data analysis.
A Simple Excel Analysis
Suppose you have a spreadsheet containing:
date;
salesperson;
region;
product;
sales value.
You could use Excel to calculate total sales and average sales.
A PivotTable could then show revenue by region. Add salesperson as another field and you can compare performance within each region.
A chart can help communicate the differences visually.
However, the quality of the result still depends on the source data.
If regions are entered inconsistently as:
London;
LONDON;
Ldn;
the analysis may incorrectly treat them as separate categories.
This is why data cleaning and preparation come before many calculations.
What Is Data Cleaning?
Data cleaning involves identifying and correcting problems that could affect analysis.
Common issues include:
- duplicate records;
- missing values;
- inconsistent categories;
- incorrect data types;
- impossible values;
- formatting inconsistencies.
Imagine analysing people’s ages and discovering one person is listed as 450 years old.
The analyst should investigate.
Simply accepting every database value as correct can produce misleading conclusions.
At the same time, analysts should not automatically delete unusual values. An apparent outlier might be an error, but it could also represent something genuinely important.
Careful data preparation and data quality checks help ensure that the final analysis is based on information that is as accurate and consistent as possible.
What Is Data Analysis Skills?
The phrase what is data analysis skills usually refers to the combination of technical and reasoning abilities needed to perform analysis effectively.
Technical tools matter, but they are only part of the skill set.
The Government Analysis Function emphasises data cleaning, manipulating datasets, analytical methods, visualisation and communicating insight.
A good beginner foundation therefore includes several areas.
Analytical Thinking
You need to break broad problems into answerable questions.
Instead of asking:
“Why is the company performing badly?”
an analyst might ask:
Which product lines declined?
When did the decline begin?
Did customer numbers or average spending change?
Data Literacy
You should understand:
data types;
percentages;
averages;
distributions;
basic statistical concepts.
Data Cleaning
Real-world data are rarely perfect.
Knowing how to identify quality issues is fundamental.
Software Skills
Useful tools can include Excel, SQL, Python, R or visualisation platforms.
Which ones matter most depends on the job.
Communication
Analysis has little value if nobody understands it.
Government analytical guidance recommends communicating data in plain language, concentrating on important findings and providing context.
Data Visualisation

Data visualisation turns information into charts, graphs, maps or other visual displays.
A good visualisation can reveal patterns that are difficult to notice in raw tables.
For example, a line chart can make a long-term trend immediately visible.
But visualisations can also mislead.
Common problems include:
inappropriate chart types;
truncated axes;
too many categories;
missing context;
visual clutter.
The objective is not to create the most colourful chart.
It is to make the evidence easier to understand accurately.
What Is Data Analyst Job?
What is data analyst job work like?
The Government Analysis Function describes data analysts as professionals who collect, organise and study data to provide insight.
The National Careers Service similarly identifies duties such as preparing data, checking quality, finding trends and relationships, creating models and presenting results to decision-makers.
In practice, a data analyst might spend a working day:
cleaning a customer dataset;
writing a query;
checking a dashboard;
investigating an unusual trend;
meeting a business team;
preparing a report.
The job therefore combines technical work with communication.
Analysts frequently need to understand what non-technical colleagues are actually asking.
What Is Data Analysis Work in Different Industries?
What is Data analysis work depends on the industry.
In healthcare, analysts might examine patient activity or service performance.
In finance, they may analyse transactions, risk or customer behaviour.
Retail analysts might study:
sales;
stock;
pricing;
customer behaviour.
Government analysts can work with:
population statistics;
public services;
economics;
policy evidence.
The core analytical principles remain similar even though the subject matter changes.
Data Analyst Career Routes in the UK
The National Careers Service currently identifies several routes into data analyst-statistician work:
- university;
- college;
- apprenticeships;
- graduate training.
Relevant university subjects can include statistics, mathematics, economics, operational research and other courses containing significant statistical study.
England also has apprenticeship pathways including Data Technician and Data Analyst routes.
This means there is no single universal route.
For career changers, practical portfolios and technical skills may also be valuable alongside formal education, although individual employers can set their own qualification requirements.
Data Analyst Salary in the UK
The National Careers Service currently provides an indicative salary range of approximately:
£28,000 for starters
to
£65,000 for experienced data analyst-statisticians.
These figures are broad career guidance rather than guaranteed salaries.
Actual earnings depend on:
experience;
industry;
location;
technical skills;
seniority.
A junior reporting analyst working mainly with Excel will not necessarily earn the same as an experienced analyst working with advanced statistics, SQL and programming.
What Is Data Analysis Course?
What is data analysis course usually means a structured programme designed to teach analytical concepts, tools or techniques.
Courses vary enormously.
A short introductory course might teach:
basic analytical thinking;
spreadsheets;
charts;
simple statistics.
A longer professional programme might cover:
Excel;
SQL;
Python;
statistics;
data cleaning;
visualisation;
projects.
University programmes can go much further into mathematics, statistics, research design and computing.
The title “Data Analysis Course” therefore tells you very little by itself.
How to Choose a Beginner Data Analysis Course
Before enrolling, check whether the course actually matches your goal.
Useful questions include:
- Does it teach practical analysis or only definitions?
- Which software is used?
- Are there exercises using real or realistic data?
- Does it cover data cleaning and interpretation?
- Is there assessment?
- Who issues any certificate or qualification?
For someone seeking employment, practical projects can be particularly valuable because they demonstrate what you can actually do.
Learning Facility Data Analysis Basics
Learning Facility currently offers a Data Analysis Basics course as a self-paced online option.
Its public page states that:
- no formal qualification is required to start;
- learners receive instant access;
- course materials remain available through lifetime access;
- a Learning Facility PDF certificate is available.
However, the page currently provides no detailed data-analysis-specific curriculum.
It also invites learners to contact the provider for an “accredited certificate” without identifying the external accrediting or regulated awarding organisation on the course page.
The programme is therefore best treated as introductory learning unless additional information confirms a particular regulated or professionally recognised status.
For a career goal, compare its detailed syllabus with the actual skills requested in current data-analyst vacancies.
A Beginner Data Analysis Learning Path
You do not need to learn everything at once.
A sensible progression might look like this:
Stage 1: Excel and data fundamentals. Learn tables, formulas, filtering, cleaning, basic charts and PivotTables.
Stage 2: Basic statistics. Understand averages, distributions, percentages, correlation and uncertainty.
Stage 3: SQL. Learn how to retrieve and combine data stored in databases.
Stage 4: Visualisation. Develop clear charts and dashboards.
Stage 5: Python or R. Add programming where your target career benefits from automation or more advanced analysis.
Throughout the process, practise explaining what your results mean.
A technically correct calculation that you cannot interpret is of limited professional value.
Build Data Analysis Projects
Projects help turn theory into competence.
A beginner portfolio could analyse:
UK public data;
fictional company sales;
transport statistics;
survey results;
sports data.
For each project, explain the whole process:
What was the question?
Where did the data come from?
What cleaning was required?
Which method did you use?
What did you find?
What limitations remain?
This demonstrates analytical thinking rather than simply software use.
Common Beginner Mistakes
One mistake is starting with software rather than the question. Learning 100 Excel functions is less useful if you do not know what problem you are trying to solve.
Another is ignoring data quality. Sophisticated analysis of unreliable information can still produce unreliable results.
Beginners also sometimes assume that a chart explains itself. It rarely does. The analyst needs to identify the important finding and provide context.
Finally, avoid overstating conclusions. Data may support a relationship or pattern without proving why it happened.
Frequently Asked Questions
What is data analysis?
What is data analysis means systematically examining information to identify patterns, relationships, differences or useful evidence that can support understanding and decisions.
What is data analysis in simple words?
What is data analysis in simple words? It means taking information, organising it and looking for an answer to a question.
What is data analysis all about?
What is data analysis all about? It covers defining questions, collecting or obtaining information, cleaning data, analysing it, interpreting the findings and communicating useful conclusions.
What is data analysis in research?
What is data analysis in research? It is the process of systematically examining research evidence to answer a research question. The method depends on whether the data are quantitative, qualitative or mixed.
What is data analysis in qualitative research?
What is data analysis in qualitative research? It involves examining non-numerical evidence such as interviews or open-ended responses to identify themes, meanings and patterns.
What is data analysis in statistics?
What is data analysis in statistics? It involves using statistical methods to describe numerical data and, where appropriate, investigate relationships or draw carefully qualified conclusions from samples.
What is data analysis in Excel?
What is data analysis in Excel? It can involve using formulas, filters, tables, PivotTables, charts, Power Query and other Excel features to clean, explore, summarise and visualise data.
What is data analysis and interpretation?
What is data analysis and interpretation? Analysis identifies findings in the data, while interpretation explains what those findings mean in the context of the original question.
What is data analyst job work like?
A data analyst typically prepares and cleans data, analyses patterns, creates visualisations and reports, and explains findings to people who use the evidence for decisions.
Do you need coding to become a data analyst?
Not necessarily at the beginning. Excel can support substantial analysis. However, SQL and programming languages such as Python or R can become valuable for many professional roles.

Conclusion
So, what is data analysis?
At its core, data analysis is the process of turning information into understanding.
That may involve numerical statistics, qualitative interviews, spreadsheets, databases or computer programming. The tools change, but the fundamental purpose remains the same: ask a useful question, examine appropriate evidence and reach a conclusion that the data can genuinely support.
Understanding what is data analysis in research also shows why there is no single analytical method. Quantitative studies may rely heavily on statistics, while what is data analysis in qualitative research involves systematically examining words, experiences and meanings.
For beginners, what is data analysis in Excel is often a useful starting point. Excel provides accessible tools for cleaning, filtering, calculating and visualising information before learners progress towards SQL, Python, R or specialist business-intelligence platforms.
Professional analysis also requires much more than software. If you are asking what is data analysis skills, the answer includes analytical thinking, statistics, data quality, visualisation and communication.
And what is data analysis and interpretation reminds us of perhaps the most important distinction of all: producing a result is not enough. Analysts need to understand what the result means, explain its limitations and communicate it accurately.
For anyone wondering what is data analyst job work involves, that combination of technical analysis and communication is central. Analysts turn messy data into evidence that businesses, researchers and public organisations can use.
Start with a question. Learn the fundamentals. Practise on real datasets. Build confidence with one tool at a time.
That is the most reliable way to move from simply looking at data to genuinely understanding it.