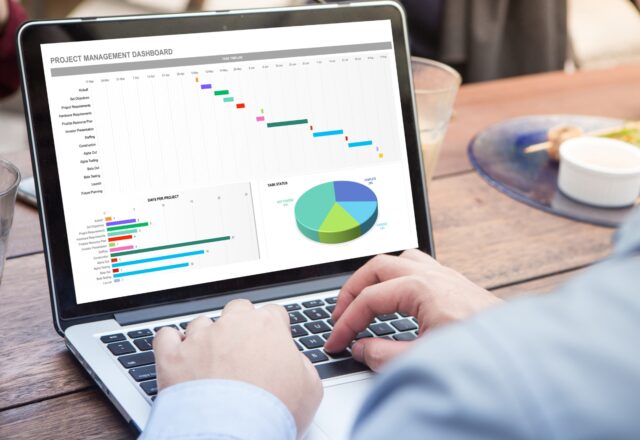
Develop practical spreadsheet skills and learn how to organise, analyse and present information confidently with this Microsoft Excel Course: Beginner to Advanced. Whether you are new to Excel or want to improve your existing knowledge, this course takes you through essential spreadsheet functions before introducing more advanced tools for reporting, data analysis and automation.
Microsoft Excel is widely used across administration, accounting, finance, human resources, business management, education and data analysis. Employers and organisations rely on spreadsheets to manage information, calculate figures, monitor performance and support business decisions. Knowing how to use Excel effectively can therefore be valuable in a wide range of professional environments.
Throughout this course, you will learn how to create and organise spreadsheets, apply formatting, use formulas, work with logical and text functions and perform lookup operations. You will also explore tables, charts, PivotTables, PivotCharts and Power Query. Further modules introduce what-if analysis, dashboards, automation and AI-related capabilities.
The course focuses on helping you understand how Excel can solve practical problems. You will develop knowledge that can support everyday administrative work, financial calculations, business reporting and more advanced data-related tasks.
By progressing through the modules, you can build a stronger understanding of spreadsheet operations and develop the confidence to work with larger amounts of information.
What You Will Learn
You will explore:
-
Excel fundamentals and spreadsheet navigation.
-
Formatting and organising spreadsheet information.
-
Formulas and essential functions.
-
Logical and text functions.
-
Lookup functions for retrieving information.
-
Tables and data management tools.
-
Charts and visual reporting.
-
PivotTables and PivotCharts.
-
Data preparation using Power Query.
-
What-if analysis and dashboard creation.
-
Automation and AI-supported spreadsheet workflows.
Course Modules
Module 1: Getting Started
Begin by exploring the Excel interface and understanding how spreadsheets are structured. You will learn about workbooks, worksheets, cells, rows and columns.
This module introduces the basic operations needed to create, open, save and navigate spreadsheet files. You will develop the confidence to work within Excel and understand how the application supports everyday information management.
Module 2: Formatting and Organising
Learn how to make spreadsheet information clear, consistent and easy to understand. You will explore cell formatting, number formats, alignment, fonts, colours, borders and worksheet organisation.
You will also consider how structured layouts improve readability and make information easier to interpret. These skills are useful when preparing professional spreadsheets for colleagues, customers or managers.
Module 3: Formulas and Basic Functions
Develop an understanding of how Excel formulas perform calculations automatically. You will explore mathematical operators, cell references and commonly used functions.
This module will help you understand how to calculate totals, averages and other useful values. You will also learn why accurate formulas are important when working with financial figures, business information and routine reports.
Module 4: Logical and Text Functions
Explore functions that help Excel evaluate conditions and process text-based information. You will learn about logical operations and the ways text functions can extract, combine or organise information.
These techniques can help you manage lists, check data conditions and reduce the time required for repetitive spreadsheet tasks.
Module 5: Lookup Functions
Understand how lookup functions help retrieve information from tables and structured datasets. You will explore how Excel can match values and return related information.
This module introduces techniques that can support administrative records, stock lists, financial reports and other information-management activities.
Module 6: Tables and Data Tools
Learn how Excel tables and data tools help organise information and improve spreadsheet management. You will explore structured tables, sorting, filtering and other features that make datasets easier to work with.
You will also understand how well-organised information supports more effective analysis and reporting.
Module 7: Charts and Visuals
Discover how charts turn spreadsheet figures into visual information. You will explore different chart types and understand how to select suitable visuals for different reporting needs.
The module will help you recognise how charts can communicate comparisons, trends and patterns more clearly than tables of numbers alone.
Module 8: PivotTables and PivotCharts
Develop an understanding of PivotTables and PivotCharts, which are widely used for summarising and analysing large datasets.
You will explore how information can be grouped, summarised and compared without manually calculating every result. These tools can help you prepare reports, examine business performance and identify useful patterns.
Module 9: Power Query
Explore Power Query as a tool for importing, cleaning and transforming data. You will learn why data preparation is an important part of analysis and how repeatable transformation steps can reduce manual work.
This module introduces workflows that can help you prepare information from different sources and make it more suitable for reporting.
Module 10: What-If Analysis and Dashboards
Understand how Excel can support planning and decision-making through what-if analysis and dashboard reporting.
You will explore how changing assumptions can affect calculations and how dashboards present important information in a consolidated format.
These skills are useful for examining business performance, comparing scenarios and communicating results to decision-makers.
Module 11: Automation and AI
Discover how automation and AI-supported capabilities can contribute to spreadsheet productivity. You will explore ways to reduce repetitive tasks and understand how modern tools can assist with data analysis and spreadsheet workflows.
You will also consider the importance of reviewing automated outputs and checking calculations before relying on them.
Who Is This Course For?
This course is suitable for:
-
Beginners who want to learn Microsoft Excel.
-
Office and administrative professionals.
-
Students and graduates developing employability skills.
-
Business owners and entrepreneurs.
-
Accounting and finance assistants.
-
HR and payroll administrators.
-
Data analysts and aspiring reporting professionals.
-
Managers who work with spreadsheets and business information.
-
Professionals who want to improve productivity.
Requirements / Prerequisites
There are no formal academic qualifications or previous Excel experience required.
You should have:
-
Access to a computer or laptop.
-
A reliable internet connection.
-
Basic computer skills.
-
Basic reading and writing skills.
-
Access to Microsoft Excel or a compatible spreadsheet environment for practical learning.
Some advanced features may vary depending on the version of Excel and the Microsoft 365 subscription being used.
Skills You Can Develop
You can develop spreadsheet organisation, formula application, data analysis, visual reporting and information-management knowledge.
You will also gain an understanding of how lookup functions, PivotTables, Power Query and dashboards can support business activities. These capabilities can help you work more efficiently with information and contribute to professional reporting tasks.
Career Path
Excel is used in many professional environments, so developing spreadsheet knowledge can support several career directions.
Potential opportunities include:
-
Administrative Assistant: Managing records, lists, schedules and reports.
-
Data Entry Clerk: Entering and organising information accurately.
-
Accounts Assistant: Supporting financial records and spreadsheet calculations.
-
Payroll Administrator: Working with payroll data and calculations.
-
HR Assistant: Maintaining employee records and workforce information.
-
Business Support Officer: Preparing reports and organising operational information.
-
Reporting Assistant: Supporting the preparation of business performance reports.
-
Junior Data Analyst: Developing towards roles involving data preparation and analysis.
More advanced analytical positions may require additional technical knowledge, experience and qualifications. Excel training alone does not guarantee employment.
Learning Outcomes
By the end of the course, you should be able to:
-
Navigate Excel and create organised spreadsheets.
-
Apply formatting to improve spreadsheet presentation.
-
Use formulas and common functions.
-
Understand logical and text functions.
-
Apply lookup techniques to retrieve information.
-
Organise datasets using tables and data tools.
-
Create charts for visual reporting.
-
Understand PivotTables and PivotCharts.
-
Explain the purpose of Power Query.
-
Explore what-if analysis and dashboard concepts.
-
Recognise opportunities for automation and AI-supported workflows.
Professional Development and Further Learning
After completing the course, you may wish to develop further skills in advanced Excel, Power BI, financial modelling, business intelligence, data analytics or database management.
Combining Excel knowledge with SQL, Python or Power BI can provide a broader foundation for data-related career development.
Take the Next Step
Excel can help you manage information, perform calculations and communicate business results more effectively. This course provides a structured learning journey from spreadsheet fundamentals to more advanced reporting and analysis tools, helping you develop useful skills for modern workplaces.